Knowledge Engineering Has an Older Visual History
Drawings, maps, tables, and notation made relationships available for people to inspect together long before computers could represent them.
A knowledge graph may contain millions of connections, yet the engineer responsible for it still needs to inspect a particular relationship with another person. They need to point to the concept, show its evidence, and see what would change if the link were removed. The computer’s representation solves one problem. Making that representation available to human thought solves another.
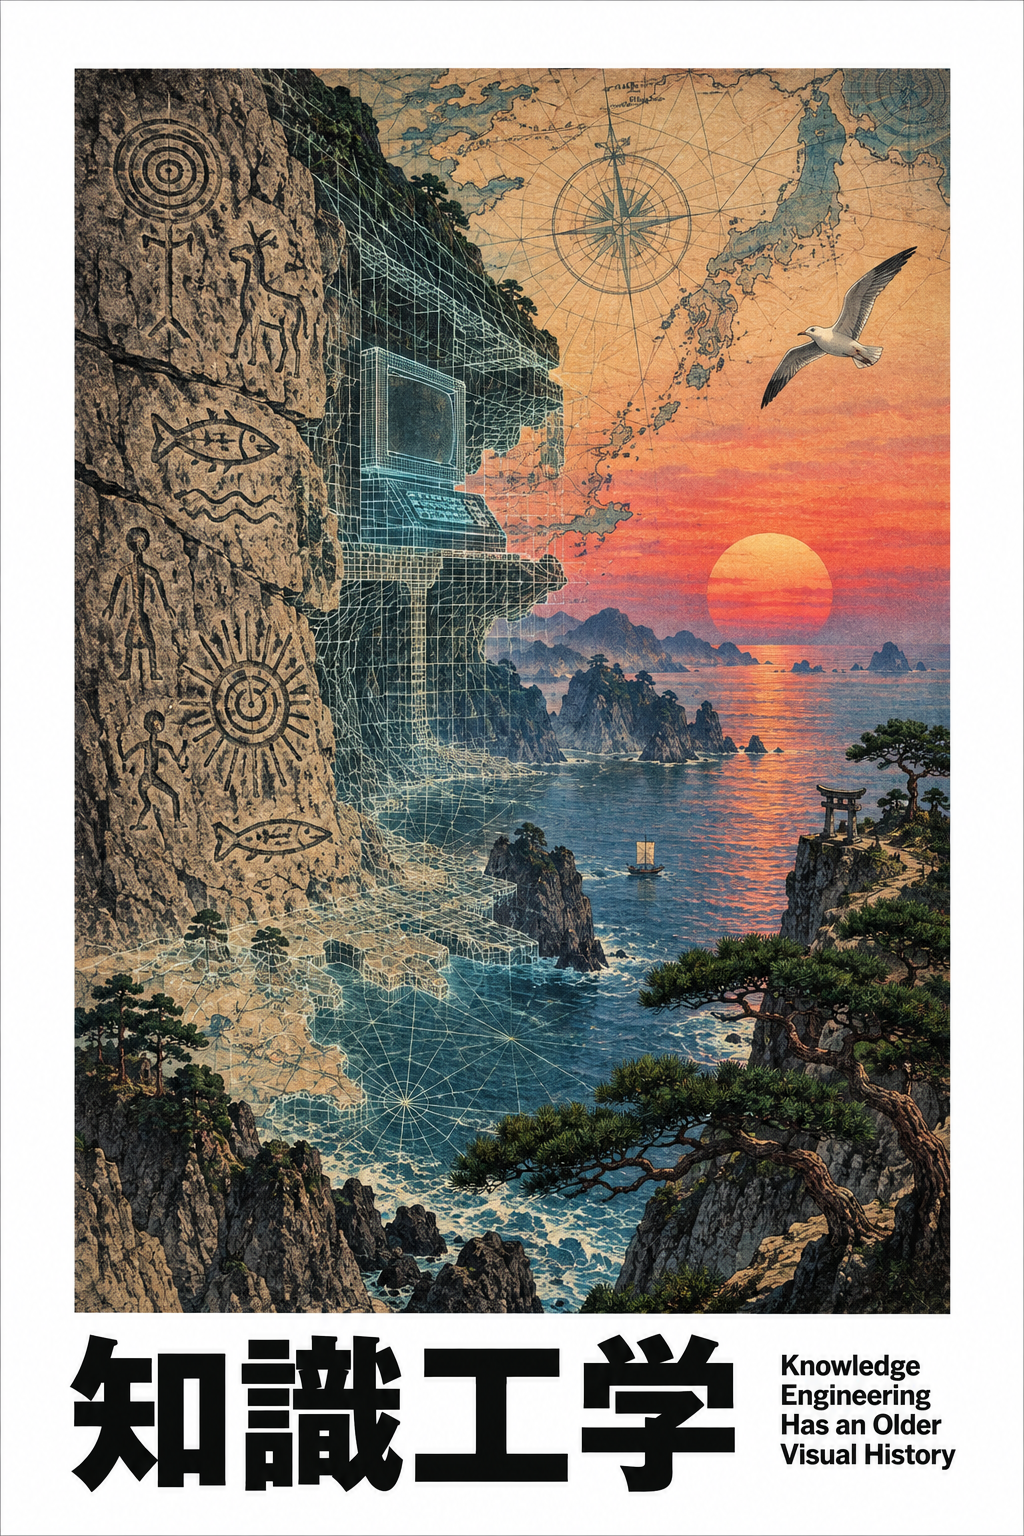
That second problem is older than computing. Writing, maps, mathematical notation, anatomical drawings, technical plans, calendars, and tables let people place parts of what they know outside their own memory. A mark can remain while its maker thinks about the next mark. Two people can look at the same arrangement, disagree about it, and change it. The external object becomes part of the reasoning process.
Seeing a relationship changes the work
Suppose a project requirement refers to a component, the component to a test, and the test to an older version of the requirement. In prose, a reader may need to hold all three relations in mind while checking whether they fit. A drawing can put them in one field of view. The drawing may reveal a missing link or a circular dependency before either person has fully explained it in words.
The benefit is not that pictures are automatically clearer. A badly drawn line can suggest certainty where only a possible relation exists. Position, color, proximity, and scale can make two things seem equivalent when they are not. Graphic design is therefore involved in the truth conditions of the working view: it affects what a person can notice and what they are likely to infer.
The history includes forms now so ordinary that their invention is easy to miss. A map lets somebody reason about distance and adjacency without walking the land again. A technical drawing lets an engineer examine fit before making a part. A family tree shows relationships that would be hard to retain from a list of names. These forms do not simply package conclusions; they allow new questions to be asked of a stable external arrangement.
Knowledge engineering inherited this visual tradition even when its formal history began inside AI. A domain expert sketching a process for an engineer is already choosing entities and relationships. The engineer turns some of them into a machine representation. The drawing may then return as an interface through which people inspect what the system thinks those relations mean.
A representation always selects
A map selects features of a place, and a diagram selects features of the work. Each makes some distinctions easy to see and others difficult. A route map may show connections without showing who has authority to use them. A process chart may show official steps while omitting the improvised work that keeps the process moving. A graph browser may show every relationship while making it impossible to find the one relevant to a decision.
The knowledge engineer and the designer face related questions. What has to be represented for a system to compute correctly? What has to be represented for a person to understand and challenge the result? The answers overlap but are not identical. A machine needs exact identifiers and constraints; a person may need sequence, comparison, and a visible route from conclusion to evidence.
For a long time these questions lived in separate professions. The next visual inventions show how close they really are. When numerical relationships were turned into charts, the form did not merely display information already understood. It helped readers discover patterns that rows of figures kept difficult to see.